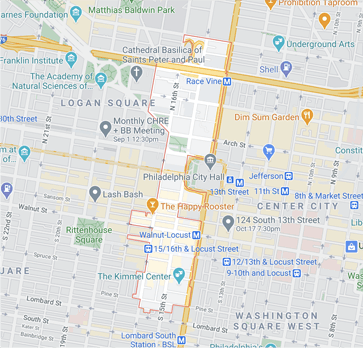
| Year | Units Listed | AVG. Listing Price | Units Sold | Avg. Sold Price | AVg Dom |
|---|---|---|---|---|---|
| 2018 | 57 | $688,191 | 17 | $840,265 | 135 |
| 2019 | 43 | $809,048 | 19 | $831,337 | 132 |

| Year | Units Listed | AVG. Listing Price | Units Sold | Avg. Sold Price | AVg Dom |
|---|---|---|---|---|---|
| 2018 | 172 | $801,396 | 65 | $803,010 | 79 |
| 2019 | 158 | $1,110,711 | 60 | $726,225 | 86 |
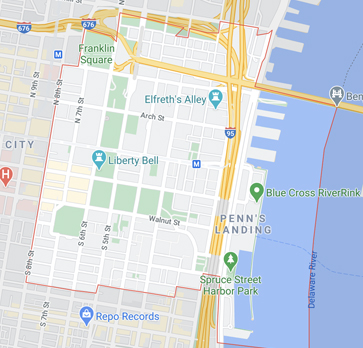
| Year | Units Listed | AVG. Listing Price | Units Sold | Avg. Sold Price | AVg Dom |
|---|---|---|---|---|---|
| 2018 | 131 | $741,019 | 51 | $649,760 | 111 |
| 2019 | 125 | $733,672 | 46 | $664,745 | 77 |
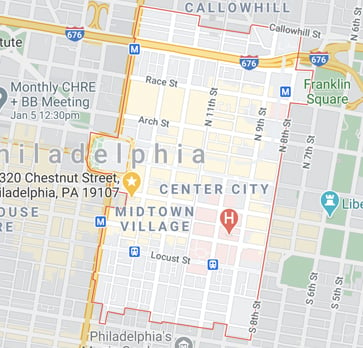
| Year | Units Listed | AVG. Listing Price | Units Sold | Avg. Sold Price | AVg Dom |
|---|---|---|---|---|---|
| 2018 | 74 | $367,374 | 23 | $310,648 | 76 |
| 2019 | 83 | $504,158 | 21 | $283,902 | 72 |
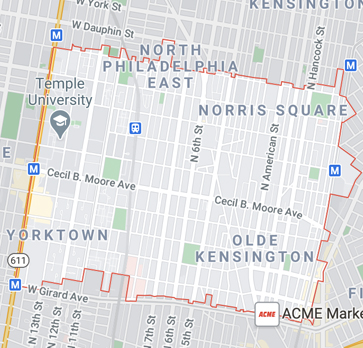
| Year | Units Listed | AVG. Listing Price | Units Sold | Avg. Sold Price | AVg Dom |
|---|---|---|---|---|---|
| 2018 | 177 | $334,810 | 74 | $317,283 | 78 |
| 2019 | 150 | $359,212 | 40 | $470,391 | 67 |
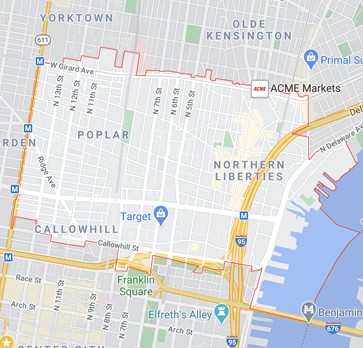
| Year | Units Listed | AVG. Listing Price | Units Sold | Avg. Sold Price | AVg Dom |
|---|---|---|---|---|---|
| 2018 | 158 | $533,557 | 72 | $459,650 | 58 |
| 2019 | 136 | $505,665 | 57 | $451,988 | 74 |
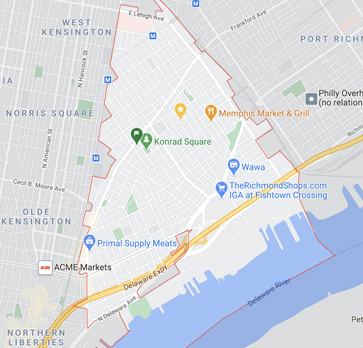
| Year | Units Listed | AVG. Listing Price | Units Sold | Avg. Sold Price | AVg Dom |
|---|---|---|---|---|---|
| 2018 | 299 | $322,253 | 159 | $355,002 | 58 |
| 2019 | 274 | $387,975 | 132 | $341,632 | 52 |
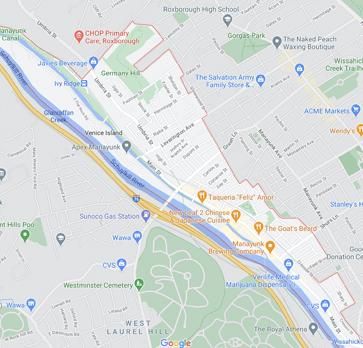
| Year | Units Listed | AVG. Listing Price | Units Sold | Avg. Sold Price | AVg Dom |
|---|---|---|---|---|---|
| 2018 | 65 | $265,410 | 22 | $256,809 | 98 |
| 2019 | 43 | $354,181 | 33 | $283,364 | 68 |
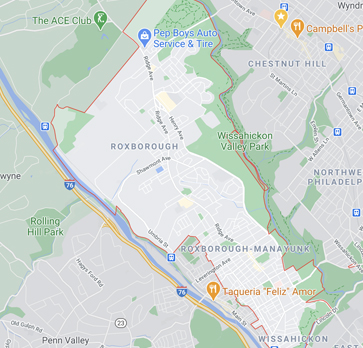
| Year | Units Listed | AVG. Listing Price | Units Sold | Avg. Sold Price | AVg Dom |
|---|---|---|---|---|---|
| 2018 | 204 | $333,597 | 114 | $254,104 | 60 |
| 2019 | 157 | $302,583 | 139 | $268,310 | 35 |
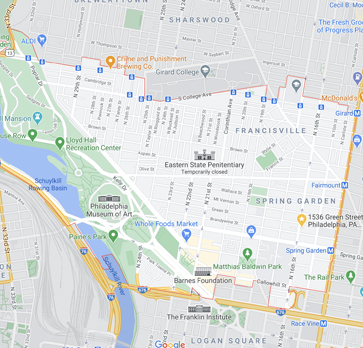
| Year | Units Listed | AVG. Listing Price | Units Sold | Avg. Sold Price | AVg Dom |
|---|---|---|---|---|---|
| 2018 | 221 | $475,655 | 120 | $484,779 | 56 |
| 2019 | 197 | $431,087 | 102 | $409,036 | 54 |
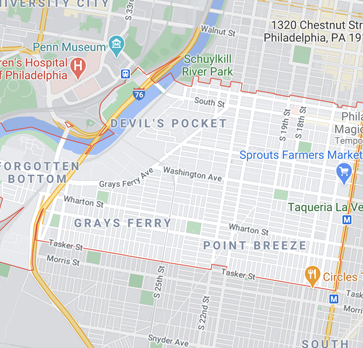
| Year | Units Listed | AVG. Listing Price | Units Sold | Avg. Sold Price | AVg Dom |
|---|---|---|---|---|---|
| 2018 | 425 | $403,434 | 240 | $401,708 | 60 |
| 2019 | 434 | $446,636 | 191 | $409,720 | 56 |
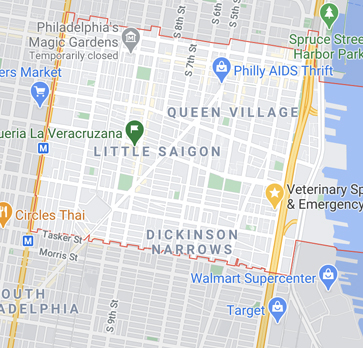
| Year | Units Listed | AVG. Listing Price | Units Sold | Avg. Sold Price | AVg Dom |
|---|---|---|---|---|---|
| 2018 | 283 | $570,061 | 165 | $481,862 | 53 |
| 2019 | 254 | $566,838 | 131 | $492,450 | 64 |
