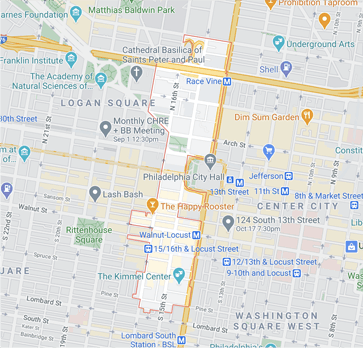
| Year | Units Listed | AVG. Listing Price | Units Sold | Avg. Sold Price | AVg Dom |
|---|---|---|---|---|---|
| 2020 | 65 | $735,915 | 29 | $607,233 | 68 |
| 2021 | 57 | $1,097,381 | 16 | $672,306 | 102 |

| Year | Units Listed | AVG. Listing Price | Units Sold | Avg. Sold Price | AVg Dom |
|---|---|---|---|---|---|
| 2020 | 153 | $1,033,043 | 84 | $748,961 | 119 |
| 2021 | 178 | $930,672 | 102 | $742,818 | 106 |
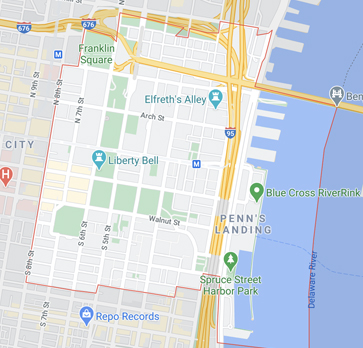
| Year | Units Listed | AVG. Listing Price | Units Sold | Avg. Sold Price | AVg Dom |
|---|---|---|---|---|---|
| 2020 | 77 | $737,545 | 69 | $556,391 | 105 |
| 2021 | 121 | $794,731 | 62 | $619,121 | 99 |
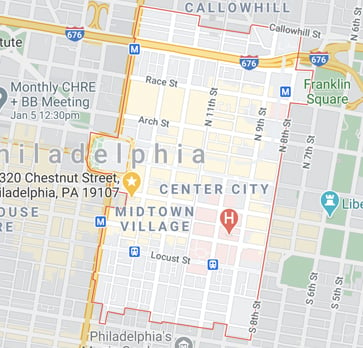
| Year | Units Listed | AVG. Listing Price | Units Sold | Avg. Sold Price | AVg Dom |
|---|---|---|---|---|---|
| 2020 | 55 | $383,080 | 32 | $393,822 | 114 |
| 2021 | 91 | $797,594 | 39 | $390,344 | 95 |
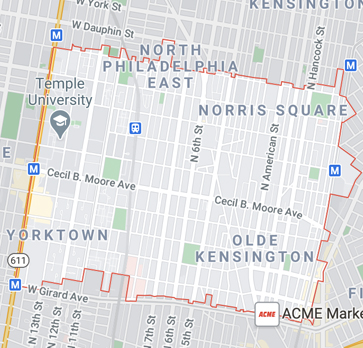
| Year | Units Listed | AVG. Listing Price | Units Sold | Avg. Sold Price | AVg Dom |
|---|---|---|---|---|---|
| 2020 | 172 | $361,579 | 104 | $314,797 | 43 |
| 2021 | 149 | $397,729 | 74 | $364,128 | 51 |
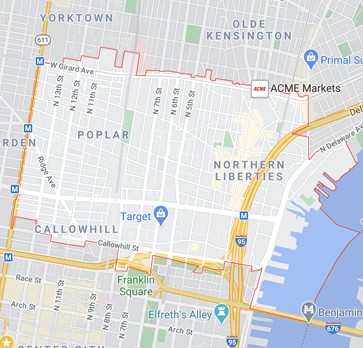
| Year | Units Listed | AVG. Listing Price | Units Sold | Avg. Sold Price | AVg Dom |
|---|---|---|---|---|---|
| 2020 | 114 | $590,102 | 85 | $489,156 | 80 |
| 2021 | 141 | $545,062 | 80 | $512,066 | 66 |
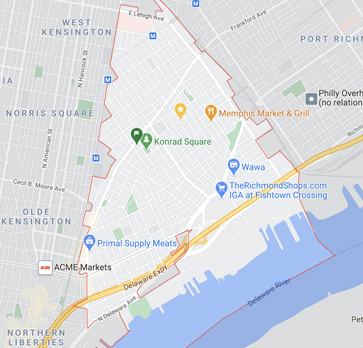
| Year | Units Listed | AVG. Listing Price | Units Sold | Avg. Sold Price | AVg Dom |
|---|---|---|---|---|---|
| 2020 | 274 | $387,302 | 167 | $373,523 | 61 |
| 2021 | 281 | $430,925 | 206 | $393,863 | 47 |
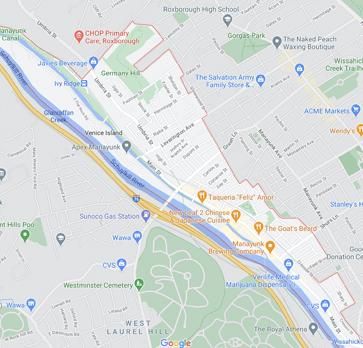
| Year | Units Listed | AVG. Listing Price | Units Sold | Avg. Sold Price | AVg Dom |
|---|---|---|---|---|---|
| 2020 | 59 | $408,624 | 45 | $384,529 | 77 |
| 2021 | 55 | $373,872 | 59 | $465,620 | 50 |
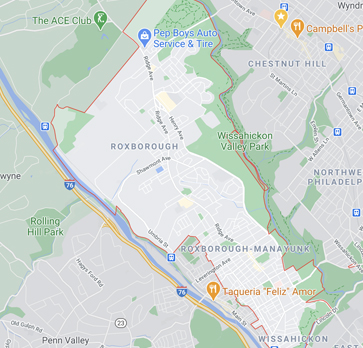
| Year | Units Listed | AVG. Listing Price | Units Sold | Avg. Sold Price | AVg Dom |
|---|---|---|---|---|---|
| 2020 | 172 | $336,351 | 132 | $297,481 | 44 |
| 2021 | 217 | $366,885 | 151 | $357,868 | 32 |
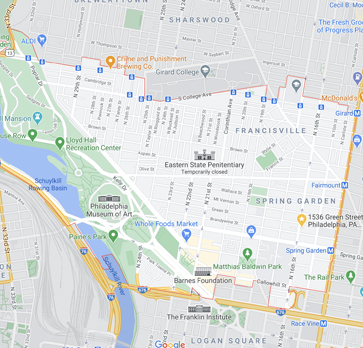
| Year | Units Listed | AVG. Listing Price | Units Sold | Avg. Sold Price | AVg Dom |
|---|---|---|---|---|---|
| 2020 | 178 | $515,501 | 81 | $448,696 | 61 |
| 2021 | 196 | $523,741 | 135 | $477,744 | 56 |
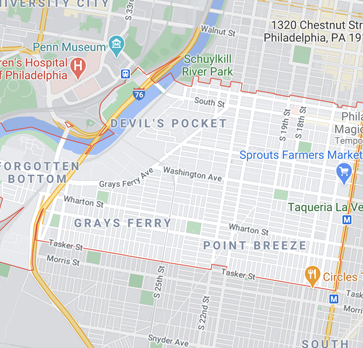
| Year | Units Listed | AVG. Listing Price | Units Sold | Avg. Sold Price | AVg Dom |
|---|---|---|---|---|---|
| 2020 | 403 | $488,732 | 235 | $445,170 | 72 |
| 2021 | 434 | $524,602 | 254 | $471,939 | 61 |
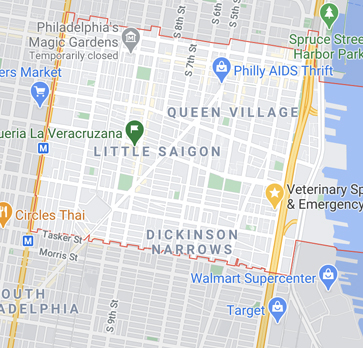
| Year | Units Listed | AVG. Listing Price | Units Sold | Avg. Sold Price | AVg Dom |
|---|---|---|---|---|---|
| 2020 | 260 | $612,562 | 144 | $521,217 | 79 |
| 2021 | 297 | $592,064 | 206 | $517,312 | 69 |
