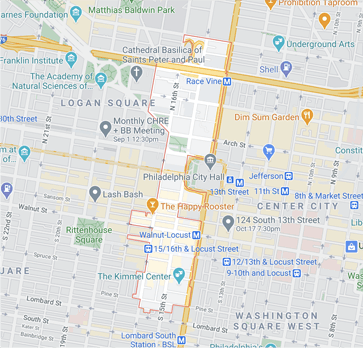
| Year | Units Listed | AVG. Listing Price | Units Sold | Avg. Sold Price | AVg Dom |
|---|---|---|---|---|---|
| 2023 | 44 | $815,892 | 6 | $403,083 | 122 |
| 2024 | 65 | $724,930 | 21 | $525,950 | 69 |

| Year | Units Listed | AVG. Listing Price | Units Sold | Avg. Sold Price | AVg Dom |
|---|---|---|---|---|---|
| 2023 | 161 | $1,130,500 | 91 | $1,138,203 | 94 |
| 2024 | 160 | $1,225,132 | 55 | $735,019 | 102 |
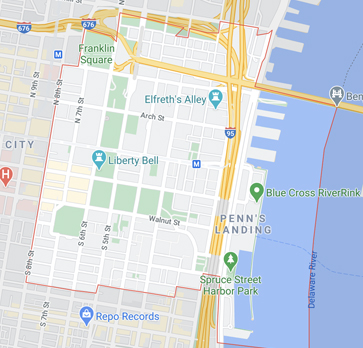
| Year | Units Listed | AVG. Listing Price | Units Sold | Avg. Sold Price | AVg Dom |
|---|---|---|---|---|---|
| 2023 | 100 | $845,501 | 45 | $536,016 | 112 |
| 2024 | 103 | $741,147 | 44 | $493,868 | 113 |
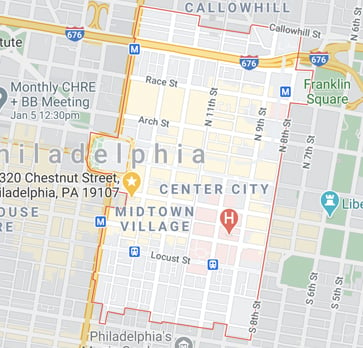
| Year | Units Listed | AVG. Listing Price | Units Sold | Avg. Sold Price | AVg Dom |
|---|---|---|---|---|---|
| 2023 | 61 | $589,139 | 23 | $736,882 | 113 |
| 2024 | 87 | $740,132 | 22 | $382,949 | 65 |
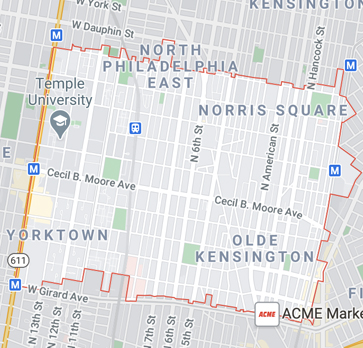
| Year | Units Listed | AVG. Listing Price | Units Sold | Avg. Sold Price | AVg Dom |
|---|---|---|---|---|---|
| 2023 | 129 | $440,017 | 51 | $426,814 | 75 |
| 2024 | 95 | $415,030 | 39 | $377,129 | 70 |
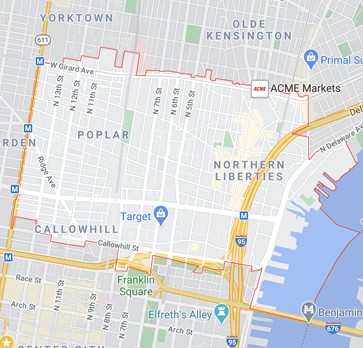
| Year | Units Listed | AVG. Listing Price | Units Sold | Avg. Sold Price | AVg Dom |
|---|---|---|---|---|---|
| 2023 | 141 | $603,593 | 46 | $547,297 | 42 |
| 2024 | 107 | $669,464 | 37 | $509,724 | 57 |
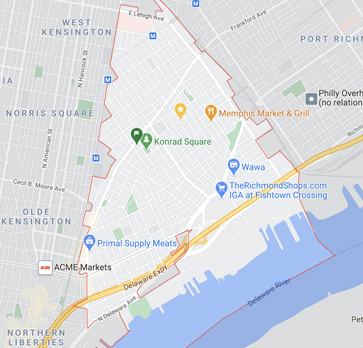
| Year | Units Listed | AVG. Listing Price | Units Sold | Avg. Sold Price | AVg Dom |
|---|---|---|---|---|---|
| 2023 | 217 | $451,110 | 104 | $425,198 | 65 |
| 2024 | 200 | $486,927 | 126 | $445,641 | 68 |
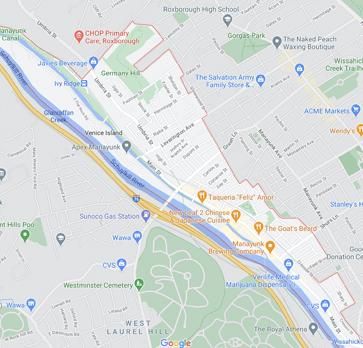
| Year | Units Listed | AVG. Listing Price | Units Sold | Avg. Sold Price | AVg Dom |
|---|---|---|---|---|---|
| 2023 | 38 | $487,894 | 30 | $377,430 | 40 |
| 2024 | 31 | $540,903 | 20 | $379,145 | 45 |
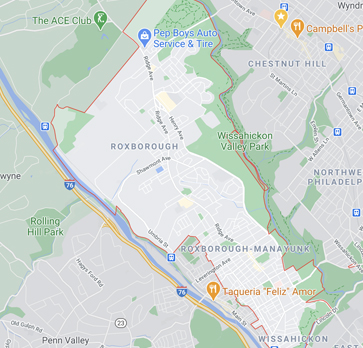
| Year | Units Listed | AVG. Listing Price | Units Sold | Avg. Sold Price | AVg Dom |
|---|---|---|---|---|---|
| 2023 | 151 | $382,990 | 120 | $364,915 | 35 |
| 2024 | 137 | $439,769 | 99 | $345,665 | 30 |
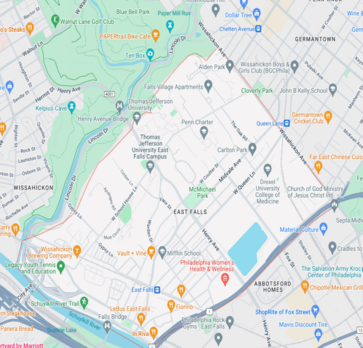
| Year | Units Listed | AVG. Listing Price | Units Sold | Avg. Sold Price | AVg Dom |
|---|---|---|---|---|---|
| 2023 | 35 | $334,342 | 27 | $339,378 | 34 |
| 2024 | 44 | $408,304 | 37 | $362,159 | 40 |
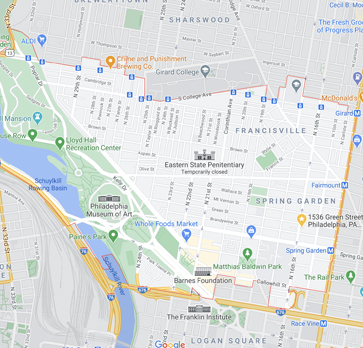
| Year | Units Listed | AVG. Listing Price | Units Sold | Avg. Sold Price | AVg Dom |
|---|---|---|---|---|---|
| 2023 | 179 | $642,314 | 104 | $472,556 | 60 |
| 2024 | 175 | $573,992 | 71 | $499,281 | 44 |
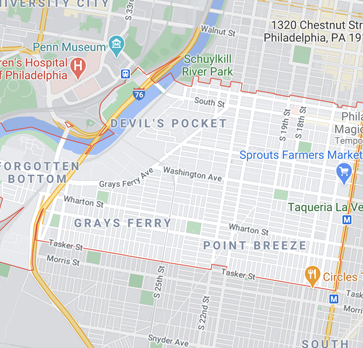
| Year | Units Listed | AVG. Listing Price | Units Sold | Avg. Sold Price | AVg Dom |
|---|---|---|---|---|---|
| 2023 | 310 | $527,140 | 164 | $456,697 | 61 |
| 2024 | 309 | $613,243 | 165 | $444,003 | 65 |
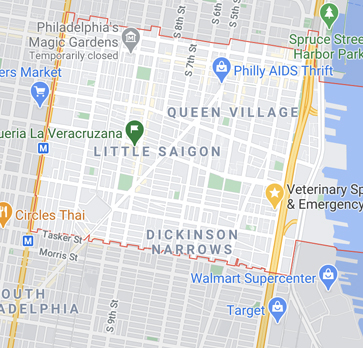
| Year | Units Listed | AVG. Listing Price | Units Sold | Avg. Sold Price | AVg Dom |
|---|---|---|---|---|---|
| 2023 | 208 | $703,164 | 95 | $489,289 | 81 |
| 2024 | 186 | $624,222 | 116 | $590,611 | 75 |
.jpg)
| Year | Units Listed | AVG. Listing Price | Units Sold | Avg. Sold Price | AVg Dom |
|---|---|---|---|---|---|
| 2023 | 148 | $289,923 | 97 | $259,056 | 47 |
| 2024 | 117 | $310,679 | 82 | $286,841 | 26 |
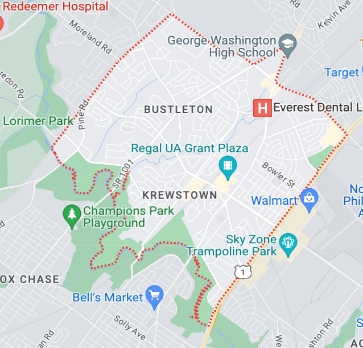
| Year | Units Listed | AVG. Listing Price | Units Sold | Avg. Sold Price | AVg Dom |
|---|---|---|---|---|---|
| 2023 | 60 | $350,529 | 59 | $321,198 | 38 |
| 2024 | 74 | $436,919 | 50 | $387,309 | 23 |
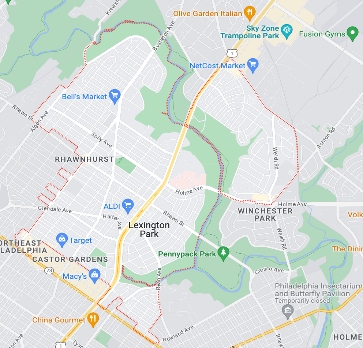
| Year | Units Listed | AVG. Listing Price | Units Sold | Avg. Sold Price | AVg Dom |
|---|---|---|---|---|---|
| 2023 | 68 | $336,069 | 52 | $296,384 | 31 |
| 2024 | 70 | $325,283 | 56 | $323,933 | 22 |
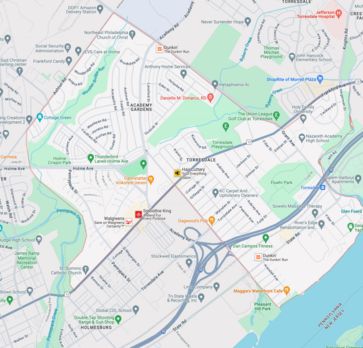
| Year | Units Listed | AVG. Listing Price | Units Sold | Avg. Sold Price | AVg Dom |
|---|---|---|---|---|---|
| 2023 | 76 | $311,119 | 59 | $297,652 | 35 |
| 2024 | 86 | $346,060 | 74 | $306,620 | 26 |
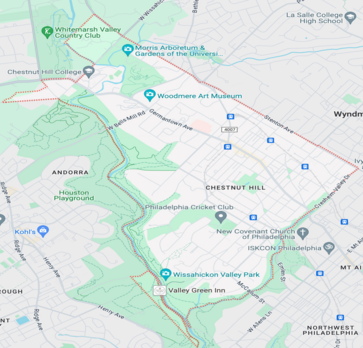
| Year | Units Listed | AVG. Listing Price | Units Sold | Avg. Sold Price | AVg Dom |
|---|---|---|---|---|---|
| 2023 | 20 | $1,256,650 | 18 | $1,021,222 | 40 |
| 2024 | 20 | $1,598,240 | 14 | $1,040,591 | 37 |
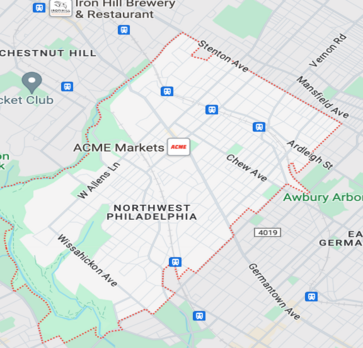
| Year | Units Listed | AVG. Listing Price | Units Sold | Avg. Sold Price | AVg Dom |
|---|---|---|---|---|---|
| 2023 | 97 | $459,756 | 60 | $437,093 | 49 |
| 2024 | 72 | $426,409 | 45 | $455,151 | 44 |
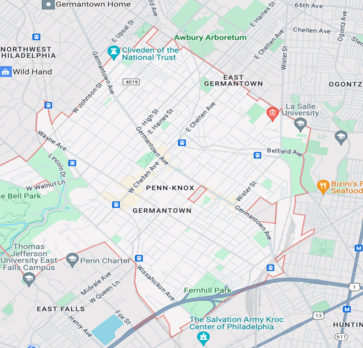
| Year | Units Listed | AVG. Listing Price | Units Sold | Avg. Sold Price | AVg Dom |
|---|---|---|---|---|---|
| 2023 | 165 | $226,148 | 62 | $199,182 | 55 |
| 2024 | 115 | $242,190 | 56 | $218,808 | 73 |
