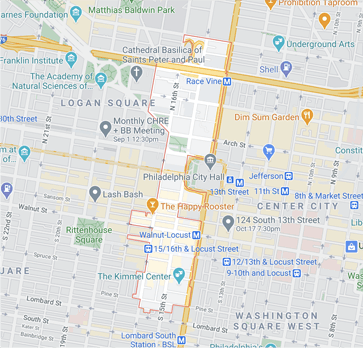
| Year | Units Listed | AVG. Listing Price | Units Sold | Avg. Sold Price | AVg Dom |
|---|---|---|---|---|---|
| 2018 | 59 | $821,731 | 31 | $583,354 | 91 |
| 2019 | 59 | $819,593 | 42 | $683,345 | 93 |

| Year | Units Listed | AVG. Listing Price | Units Sold | Avg. Sold Price | AVg Dom |
|---|---|---|---|---|---|
| 2018 | 225 | $880,458 | 119 | $674,970 | 70 |
| 2019 | 200 | $856,492 | 102 | $837,512 | 78 |
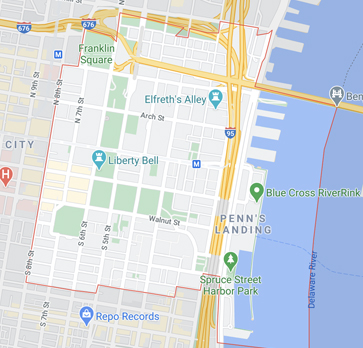
| Year | Units Listed | AVG. Listing Price | Units Sold | Avg. Sold Price | AVg Dom |
|---|---|---|---|---|---|
| 2018 | 165 | $661,950 | 81 | $543,428 | 56 |
| 2019 | 112 | $615,776 | 82 | $574,558 | 69 |
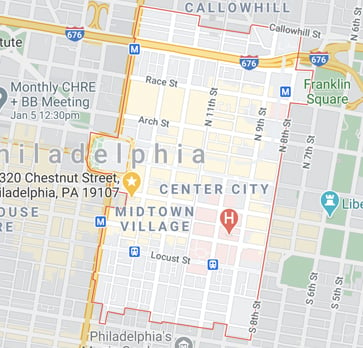
| Year | Units Listed | AVG. Listing Price | Units Sold | Avg. Sold Price | AVg Dom |
|---|---|---|---|---|---|
| 2018 | 98 | $344,563 | 58 | $464,621 | 63 |
| 2019 | 97 | $531,972 | 53 | $483,764 | 71 |
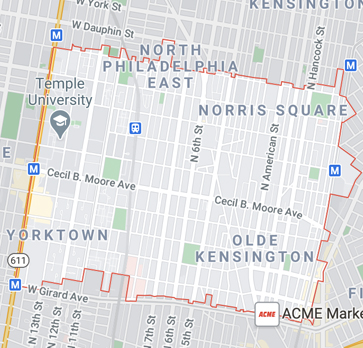
| Year | Units Listed | AVG. Listing Price | Units Sold | Avg. Sold Price | AVg Dom |
|---|---|---|---|---|---|
| 2018 | 244 | $348,430 | 137 | $298,949 | 45 |
| 2019 | 171 | $341,851 | 85 | $361,713 | 50 |
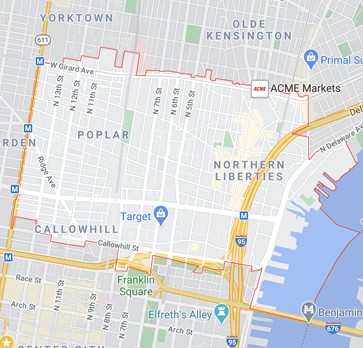
| Year | Units Listed | AVG. Listing Price | Units Sold | Avg. Sold Price | AVg Dom |
|---|---|---|---|---|---|
| 2018 | 150 | $483,464 | 117 | $520,534 | 67 |
| 2019 | 162 | $512,377 | 85 | $507,838 | 57 |
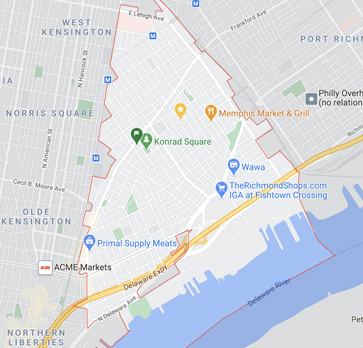
| Year | Units Listed | AVG. Listing Price | Units Sold | Avg. Sold Price | AVg Dom |
|---|---|---|---|---|---|
| 2018 | 428 | $368,509 | 294 | $340,950 | 47 |
| 2019 | 314 | $391,834 | 244 | $360,000 | 43 |
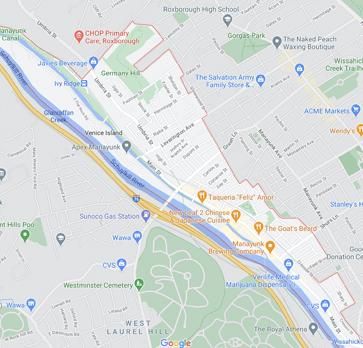
| Year | Units Listed | AVG. Listing Price | Units Sold | Avg. Sold Price | AVg Dom |
|---|---|---|---|---|---|
| 2018 | 99 | $295,096 | 55 | $281,637 | 51 |
| 2019 | 72 | $295,096 | 55 | $295,333 | 47 |
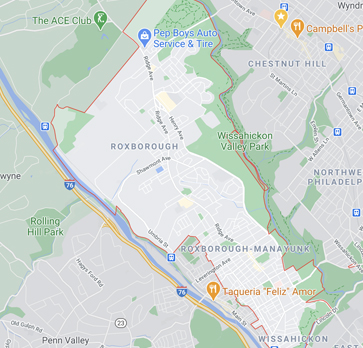
| Year | Units Listed | AVG. Listing Price | Units Sold | Avg. Sold Price | AVg Dom |
|---|---|---|---|---|---|
| 2018 | 307 | $293,400 | 198 | $284,283 | 36 |
| 2019 | 299 | $319,921 | 212 | $284,283 | 38 |
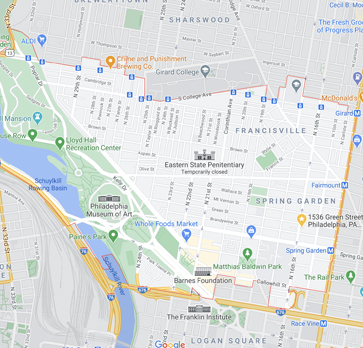
| Year | Units Listed | AVG. Listing Price | Units Sold | Avg. Sold Price | AVg Dom |
|---|---|---|---|---|---|
| 2018 | 283 | $493,458 | 200 | $446,621 | 46 |
| 2019 | 238 | $430,801 | 150 | $425,794 | 46 |
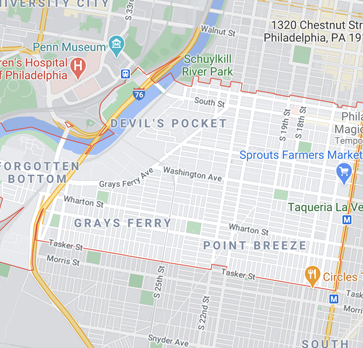
| Year | Units Listed | AVG. Listing Price | Units Sold | Avg. Sold Price | AVg Dom |
|---|---|---|---|---|---|
| 2018 | 525 | $425,040 | 383 | $429,873 | 44 |
| 2019 | 520 | $446,025 | 328 | $441,317 | 48 |
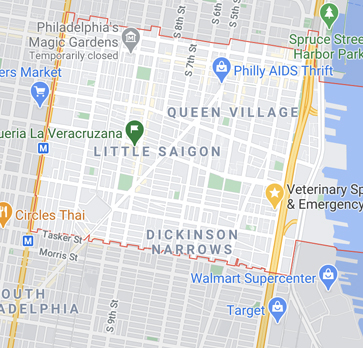
| Year | Units Listed | AVG. Listing Price | Units Sold | Avg. Sold Price | AVg Dom |
|---|---|---|---|---|---|
| 2018 | 382 | $525,296 | 218 | $524,395 | 45 |
| 2019 | 310 | $522,127 | 187 | $491,953 | 46 |
