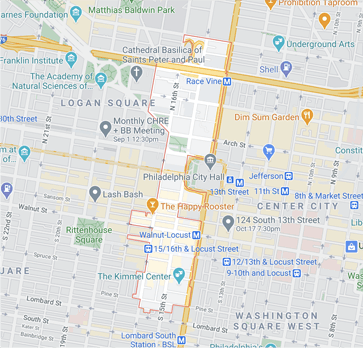
| Year | Units Listed | AVG. Listing Price | Units Sold | Avg. Sold Price | AVg Dom |
|---|---|---|---|---|---|
| 2022 | 33 | $893,864 | 28 | $510,000 | 56 |
| 2023 | 43 | $760,218 | 17 | $382,134 | 94 |

| Year | Units Listed | AVG. Listing Price | Units Sold | Avg. Sold Price | AVg Dom |
|---|---|---|---|---|---|
| 2022 | 135 | $990,862 | 95 | $751,472 | 90 |
| 2023 | 155 | $1,290,965 | 115 | $994,254 | 103 |
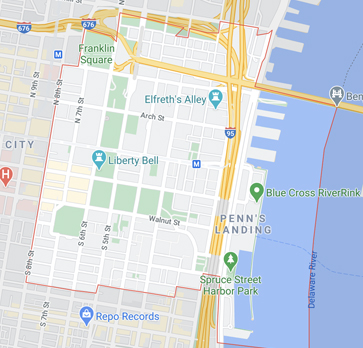
| Year | Units Listed | AVG. Listing Price | Units Sold | Avg. Sold Price | AVg Dom |
|---|---|---|---|---|---|
| 2022 | 101 | $973,339 | 63 | $534,683 | 55 |
| 2023 | 83 | $637,318 | 52 | $632,044 | 47 |
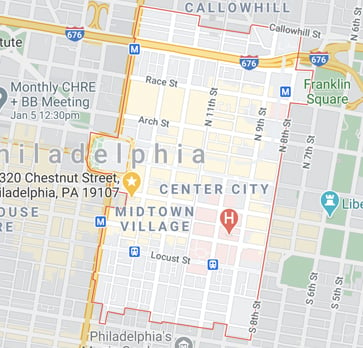
| Year | Units Listed | AVG. Listing Price | Units Sold | Avg. Sold Price | AVg Dom |
|---|---|---|---|---|---|
| 2022 | 71 | $830,437 | 32 | $557,055 | 50 |
| 2023 | 60 | $394,316 | 33 | $298,161 | 41 |
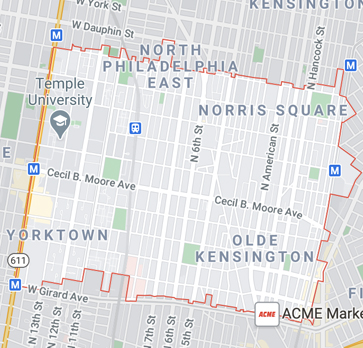
| Year | Units Listed | AVG. Listing Price | Units Sold | Avg. Sold Price | AVg Dom |
|---|---|---|---|---|---|
| 2022 | 152 | $422,304 | 76 | $406,293 | 49 |
| 2023 | 88 | $397,081 | 57 | $434,226 | 42 |
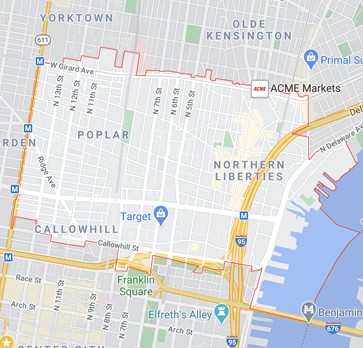
| Year | Units Listed | AVG. Listing Price | Units Sold | Avg. Sold Price | AVg Dom |
|---|---|---|---|---|---|
| 2022 | 129 | $585,607 | 93 | $553,761 | 44 |
| 2023 | 122 | $618,248 | 74 | $518,892 | 37 |
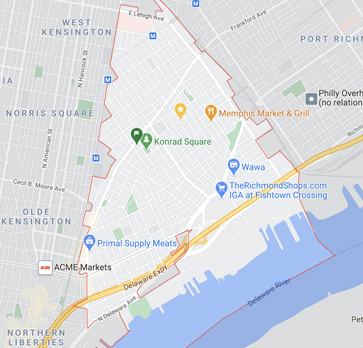
| Year | Units Listed | AVG. Listing Price | Units Sold | Avg. Sold Price | AVg Dom |
|---|---|---|---|---|---|
| 2022 | 249 | $474,835 | 154 | $482,363 | 35 |
| 2023 | 223 | $480,796 | 140 | $422,864 | 40 |
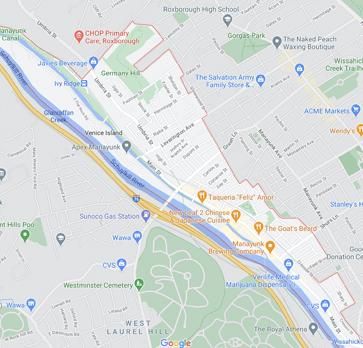
| Year | Units Listed | AVG. Listing Price | Units Sold | Avg. Sold Price | AVg Dom |
|---|---|---|---|---|---|
| 2022 | 51 | $373,454 | 51 | $335,746 | 26 |
| 2023 | 39 | $412,607 | 34 | $443,593 | 20 |
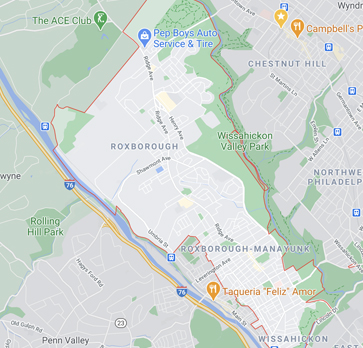
| Year | Units Listed | AVG. Listing Price | Units Sold | Avg. Sold Price | AVg Dom |
|---|---|---|---|---|---|
| 2022 | 180 | $398,430 | 158 | $361,206 | 19 |
| 2023 | 149 | $435,804 | 126 | $389,155 | 26 |
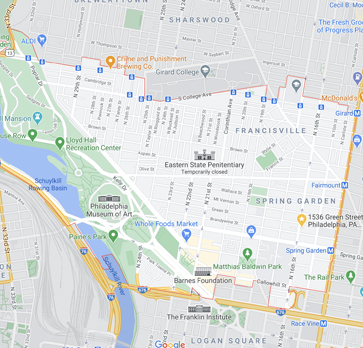
| Year | Units Listed | AVG. Listing Price | Units Sold | Avg. Sold Price | AVg Dom |
|---|---|---|---|---|---|
| 2022 | 210 | $554,511 | 144 | $493,885 | 39 |
| 2023 | 147 | $558,650 | 116 | $504,042 | 33 |
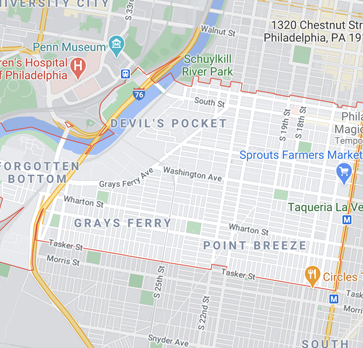
| Year | Units Listed | AVG. Listing Price | Units Sold | Avg. Sold Price | AVg Dom |
|---|---|---|---|---|---|
| 2022 | 356 | $519,794 | 223 | $526,995 | 37 |
| 2023 | 303 | $592,251 | 165 | $510,466 | 39 |
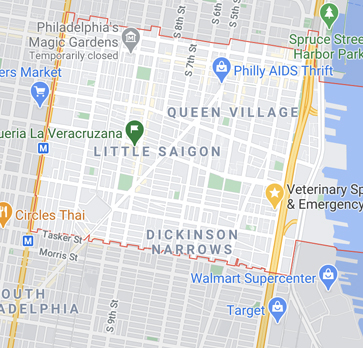
| Year | Units Listed | AVG. Listing Price | Units Sold | Avg. Sold Price | AVg Dom |
|---|---|---|---|---|---|
| 2022 | 238 | $628,952 | 159 | $544,281 | 40 |
| 2023 | 213 | $598,126 | 136 | $578,070 | 45 |
.jpg)
| Year | Units Listed | AVG. Listing Price | Units Sold | Avg. Sold Price | AVg Dom |
|---|---|---|---|---|---|
| 2022 | 214 | $286,890 | 144 | $275,392 | 19 |
| 2023 | 132 | $287,562 | 109 | $290,037 | 25 |
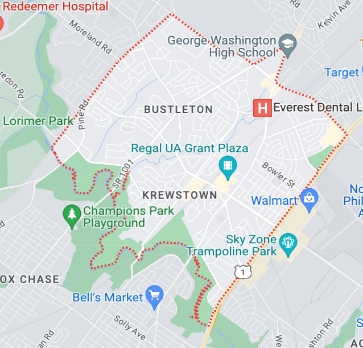
| Year | Units Listed | AVG. Listing Price | Units Sold | Avg. Sold Price | AVg Dom |
|---|---|---|---|---|---|
| 2022 | 105 | $386,167 | 87 | $389,509 | 17 |
| 2023 | 79 | $399,868 | 54 | $387,852 | 18 |
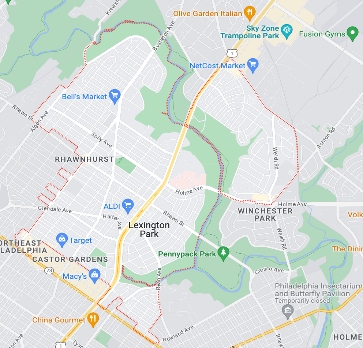
| Year | Units Listed | AVG. Listing Price | Units Sold | Avg. Sold Price | AVg Dom |
|---|---|---|---|---|---|
| 2022 | 95 | $325,976 | 83 | $308,593 | 19 |
| 2023 | 85 | $316,526 | 69 | $309,970 | 14 |
