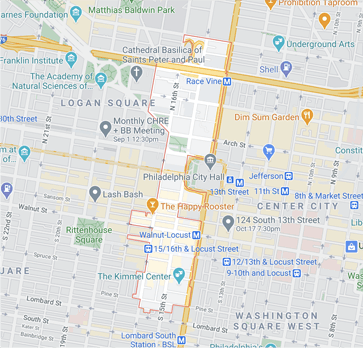
| Year | Units Listed | AVG. Listing Price | Units Sold | Avg. Sold Price | AVg Dom |
|---|---|---|---|---|---|
| 2016 | 36 | $774,712 | 24 | $565,813 | 81 |
| 2017 | 55 | $692,224 | 29 | $682,103 | 125 |
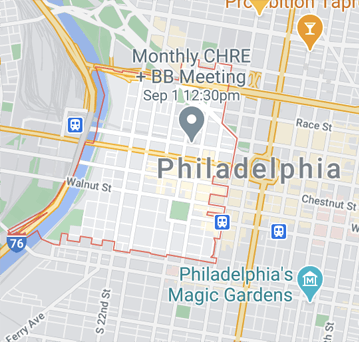
| Year | Units Listed | AVG. Listing Price | Units Sold | Avg. Sold Price | AVg Dom |
|---|---|---|---|---|---|
| 2016 | 131 | $987,961 | 79 | $920,891 | 80 |
| 2017 | 125 | $862,047 | 109 | $934,366 | 84 |
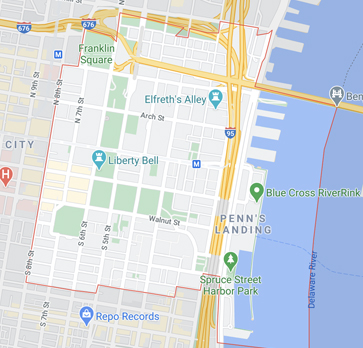
| Year | Units Listed | AVG. Listing Price | Units Sold | Avg. Sold Price | AVg Dom |
|---|---|---|---|---|---|
| 2016 | 142 | $761,430 | 94 | $584,277 | 65 |
| 2017 | 126 | $761,434 | 70 | $663,349 | 86 |
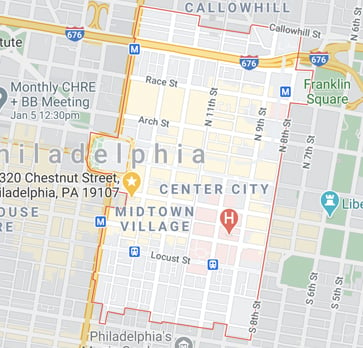
| Year | Units Listed | AVG. Listing Price | Units Sold | Avg. Sold Price | AVg Dom |
|---|---|---|---|---|---|
| 2016 | 72 | $391,143 | 37 | $328,747 | 69 |
| 2017 | 67 | $520,498 | 54 | $465,196 | 64 |
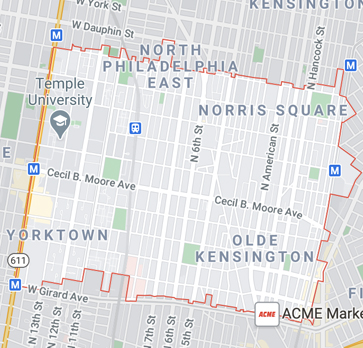
| Year | Units Listed | AVG. Listing Price | Units Sold | Avg. Sold Price | AVg Dom |
|---|---|---|---|---|---|
| 2016 | 136 | $278,919 | 86 | $266,715 | 67 |
| 2017 | 179 | $314,461 | 92 | $302,432 | 45 |
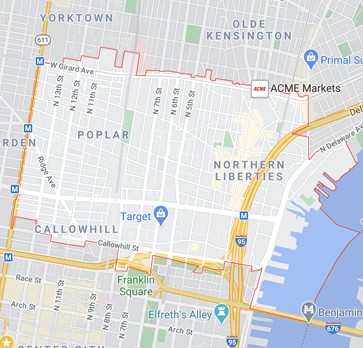
| Year | Units Listed | AVG. Listing Price | Units Sold | Avg. Sold Price | AVg Dom |
|---|---|---|---|---|---|
| 2016 | 166 | $501,398 | 82 | $490,305 | 65 |
| 2017 | 131 | $539,148 | 76 | $433,036 | 72 |
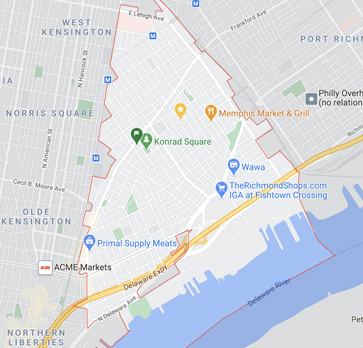
| Year | Units Listed | AVG. Listing Price | Units Sold | Avg. Sold Price | AVg Dom |
|---|---|---|---|---|---|
| 2016 | 272 | $313,966 | 208 | $305,556 | 48 |
| 2017 | 325 | $357,264 | 192 | $332,979 | 47 |
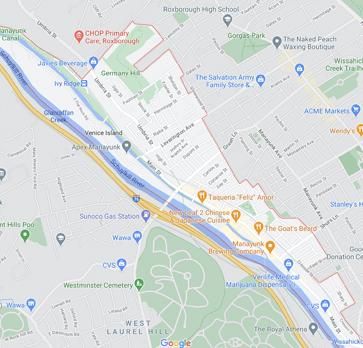
| Year | Units Listed | AVG. Listing Price | Units Sold | Avg. Sold Price | AVg Dom |
|---|---|---|---|---|---|
| 2016 | 69 | $300,100 | 49 | $286,310 | 57 |
| 2017 | 71 | $272,998 | 51 | $291,474 | 62 |
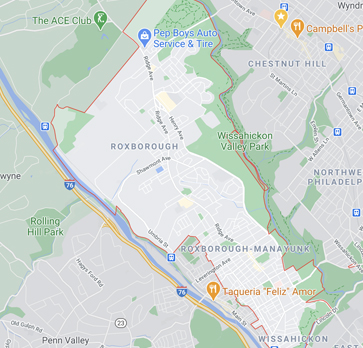
| Year | Units Listed | AVG. Listing Price | Units Sold | Avg. Sold Price | AVg Dom |
|---|---|---|---|---|---|
| 2016 | 244 | $280,940 | 186 | $254,434 | 56 |
| 2017 | 256 | $326,865 | 197 | $250,069 | 42 |
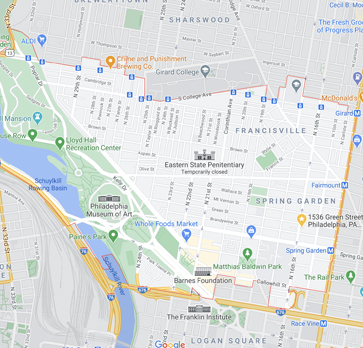
| Year | Units Listed | AVG. Listing Price | Units Sold | Avg. Sold Price | AVg Dom |
|---|---|---|---|---|---|
| 2016 | 176 | $418,878 | 160 | $391,503 | 50 |
| 2017 | 242 | $479,699 | 137 | $413,321 | 39 |
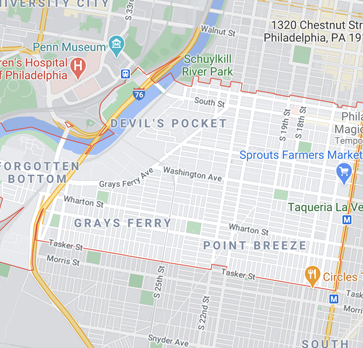
| Year | Units Listed | AVG. Listing Price | Units Sold | Avg. Sold Price | AVg Dom |
|---|---|---|---|---|---|
| 2016 | 371 | $332,487 | 275 | $391,194 | 46 |
| 2017 | 429 | $366,498 | 279 | $390,912 | 31 |
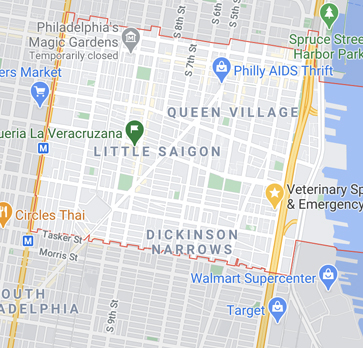
| Year | Units Listed | AVG. Listing Price | Units Sold | Avg. Sold Price | AVg Dom |
|---|---|---|---|---|---|
| 2016 | 279 | $499,183 | 189 | $419,967 | 54 |
| 2017 | 299 | $500,339 | 235 | $529,044 | 52 |
