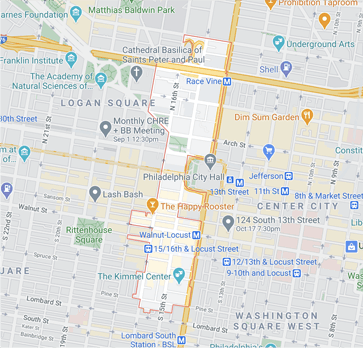
| Year | Units Listed | AVG. Listing Price | Units Sold | Avg. Sold Price | AVg Dom |
|---|---|---|---|---|---|
| 2017 | 39 | $978,428 | 27 | $894,093 | 97 |
| 2018 | 37 | $1,093,568 | 19 | $761,805 | 83 |

| Year | Units Listed | AVG. Listing Price | Units Sold | Avg. Sold Price | AVg Dom |
|---|---|---|---|---|---|
| 2017 | 107 | $1,054,010 | 89 | $800,239 | 97 |
| 2018 | 110 | $964,153 | 62 | $835,938 | 83 |
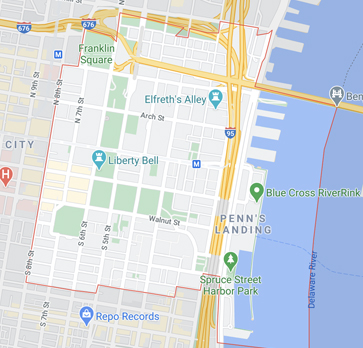
| Year | Units Listed | AVG. Listing Price | Units Sold | Avg. Sold Price | AVg Dom |
|---|---|---|---|---|---|
| 2017 | 71 | $675,758 | 88 | $615,848 | 72 |
| 2018 | 109 | $800,199 | 89 | $640,987 | 77 |
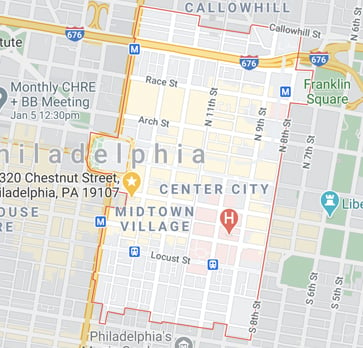
| Year | Units Listed | AVG. Listing Price | Units Sold | Avg. Sold Price | AVg Dom |
|---|---|---|---|---|---|
| 2017 | 51 | $450,942 | 48 | $508,753 | 63 |
| 2018 | 41 | $471,156 | 28 | $379,930 | 79 |
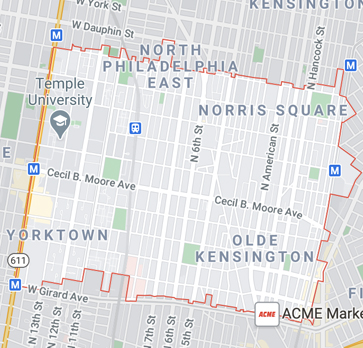
| Year | Units Listed | AVG. Listing Price | Units Sold | Avg. Sold Price | AVg Dom |
|---|---|---|---|---|---|
| 2017 | 140 | $361,826 | 104 | $279,348 | 49 |
| 2018 | 98 | $328,067 | 94 | $407,176 | 41 |
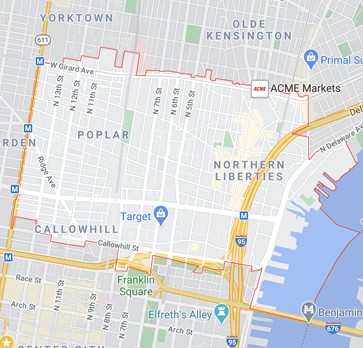
| Year | Units Listed | AVG. Listing Price | Units Sold | Avg. Sold Price | AVg Dom |
|---|---|---|---|---|---|
| 2017 | 125 | $546,723 | 63 | $541,556 | 64 |
| 2018 | 90 | $472,089 | 81 | $513,600 | 71 |
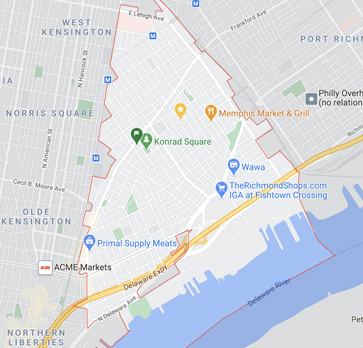
| Year | Units Listed | AVG. Listing Price | Units Sold | Avg. Sold Price | AVg Dom |
|---|---|---|---|---|---|
| 2017 | 274 | $340,436 | 168 | $326,933 | 47 |
| 2018 | 215 | $360,025 | 183 | $324,188 | 47 |
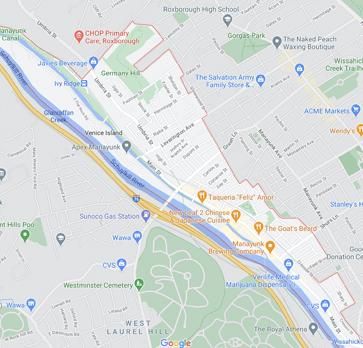
| Year | Units Listed | AVG. Listing Price | Units Sold | Avg. Sold Price | AVg Dom |
|---|---|---|---|---|---|
| 2017 | 51 | $348,068 | 45 | $257,498 | 56 |
| 2018 | 51 | $409,349 | 31 | $249,389 | 59 |
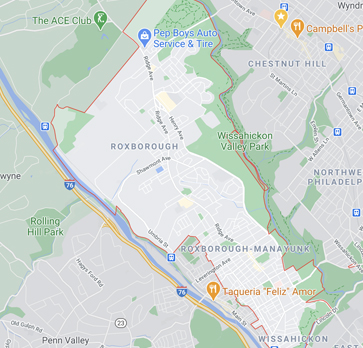
| Year | Units Listed | AVG. Listing Price | Units Sold | Avg. Sold Price | AVg Dom |
|---|---|---|---|---|---|
| 2017 | 184 | $313,687 | 159 | $268,862 | 54 |
| 2018 | 157 | $302,583 | 139 | $268,310 | 35 |
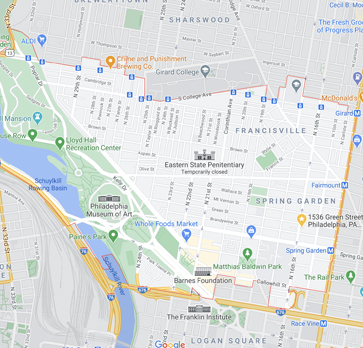
| Year | Units Listed | AVG. Listing Price | Units Sold | Avg. Sold Price | AVg Dom |
|---|---|---|---|---|---|
| 2017 | 152 | $465,757 | 140 | $439,210 | 49 |
| 2018 | 134 | $461,548 | 117 | $451,669 | 48 |
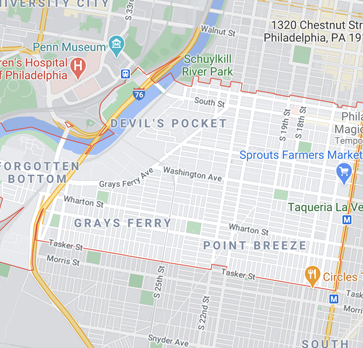
| Year | Units Listed | AVG. Listing Price | Units Sold | Avg. Sold Price | AVg Dom |
|---|---|---|---|---|---|
| 2017 | 309 | $376,544 | 237 | $386,850 | 46 |
| 2018 | 314 | $414,118 | 223 | $401,777 | 42 |
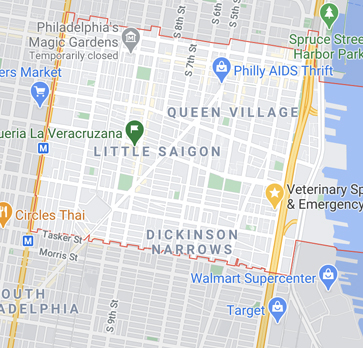
| Year | Units Listed | AVG. Listing Price | Units Sold | Avg. Sold Price | AVg Dom |
|---|---|---|---|---|---|
| 2017 | 237 | $576,312 | 166 | $557,194 | 52 |
| 2018 | 202 | $513,229 | 153 | $504,730 | 46 |
