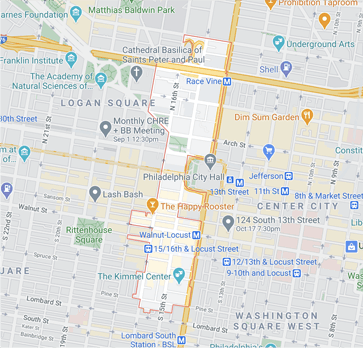
| Year | Units Listed | AVG. Listing Price | Units Sold | Avg. Sold Price | AVg Dom |
|---|---|---|---|---|---|
| 2018 | 37 | $1,093,568 | 19 | $761,805 | 83 |
| 2019 | 30 | $774,293 | 28 | $711,175 | 84 |

| Year | Units Listed | AVG. Listing Price | Units Sold | Avg. Sold Price | AVg Dom |
|---|---|---|---|---|---|
| 2018 | 110 | $964,153 | 62 | $835,938 | 83 |
| 2019 | 92 | $915,968 | 92 | $666,340 | 82 |
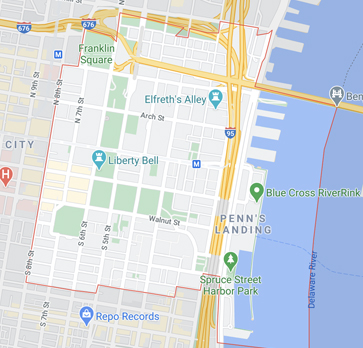
| Year | Units Listed | AVG. Listing Price | Units Sold | Avg. Sold Price | AVg Dom |
|---|---|---|---|---|---|
| 2018 | 78 | $792,507 | 57 | $656,060 | 75 |
| 2019 | 72 | $723,647 | 57 | $642,429 | 77 |
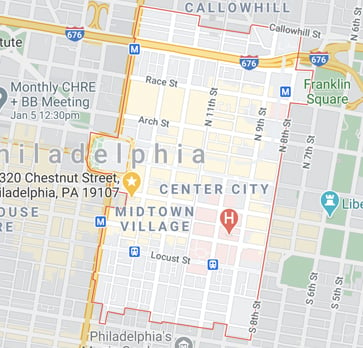
| Year | Units Listed | AVG. Listing Price | Units Sold | Avg. Sold Price | AVg Dom |
|---|---|---|---|---|---|
| 2018 | 41 | $471,156 | 28 | $379,930 | 79 |
| 2019 | 37 | $448,513 | 36 | $395,547 | 63 |
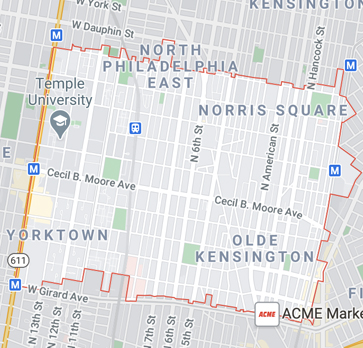
| Year | Units Listed | AVG. Listing Price | Units Sold | Avg. Sold Price | AVg Dom |
|---|---|---|---|---|---|
| 2018 | 98 | $328,067 | 94 | $407,176 | 41 |
| 2019 | 142 | $350,433 | 70 | $383,634 | 54 |
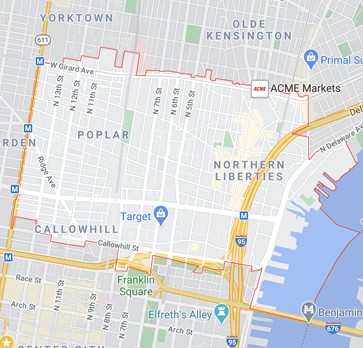
| Year | Units Listed | AVG. Listing Price | Units Sold | Avg. Sold Price | AVg Dom |
|---|---|---|---|---|---|
| 2018 | 90 | $472,089 | 81 | $513,600 | 71 |
| 2019 | 95 | $540,652 | 33 | $536,027 | 76 |
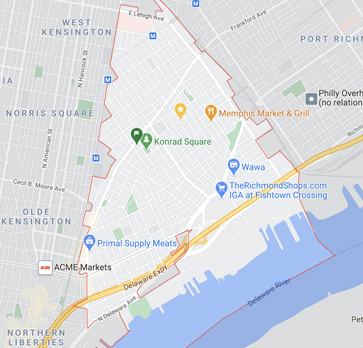
| Year | Units Listed | AVG. Listing Price | Units Sold | Avg. Sold Price | AVg Dom |
|---|---|---|---|---|---|
| 2018 | 215 | $360,025 | 183 | $324,188 | 47 |
| 2019 | 218 | $397,761 | 195 | $367,481 | 44 |
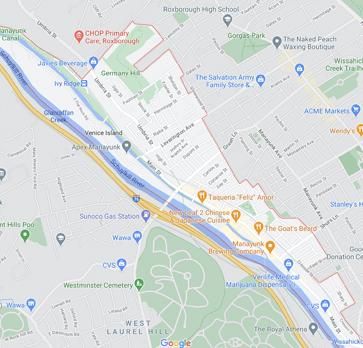
| Year | Units Listed | AVG. Listing Price | Units Sold | Avg. Sold Price | AVg Dom |
|---|---|---|---|---|---|
| 2018 | 51 | $409,349 | 31 | $249,389 | 59 |
| 2019 | 33 | $435,329 | 38 | $406,217 | 53 |
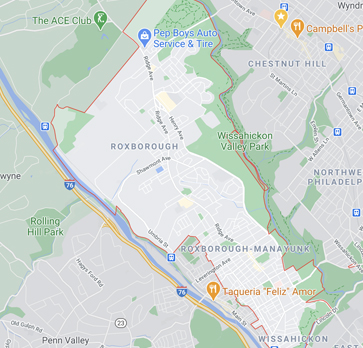
| Year | Units Listed | AVG. Listing Price | Units Sold | Avg. Sold Price | AVg Dom |
|---|---|---|---|---|---|
| 2018 | 157 | $302,583 | 139 | $268,310 | 35 |
| 2019 | 170 | $313,132 | 154 | $285,534 | 50 |
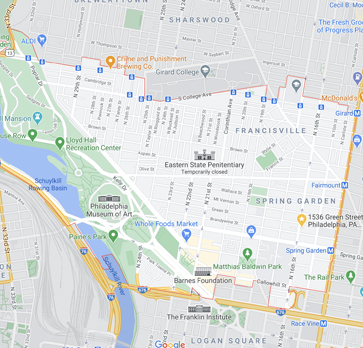
| Year | Units Listed | AVG. Listing Price | Units Sold | Avg. Sold Price | AVg Dom |
|---|---|---|---|---|---|
| 2018 | 134 | $461,548 | 117 | $451,669 | 48 |
| 2019 | 104 | $493,840 | 110 | $413,570 | 56 |
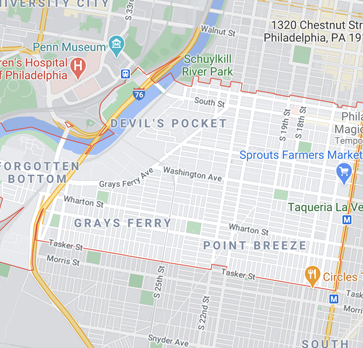
| Year | Units Listed | AVG. Listing Price | Units Sold | Avg. Sold Price | AVg Dom |
|---|---|---|---|---|---|
| 2018 | 314 | $414,118 | 223 | $401,777 | 42 |
| 2019 | 322 | $429,498 | 220 | $405,030 | 52 |
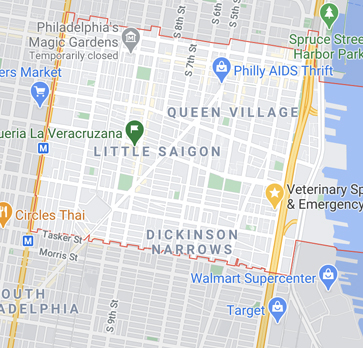
| Year | Units Listed | AVG. Listing Price | Units Sold | Avg. Sold Price | AVg Dom |
|---|---|---|---|---|---|
| 2018 | 202 | $513,229 | 153 | $504,730 | 46 |
| 2019 | 194 | $3,429,569 | 145 | $485,071 | 63 |
