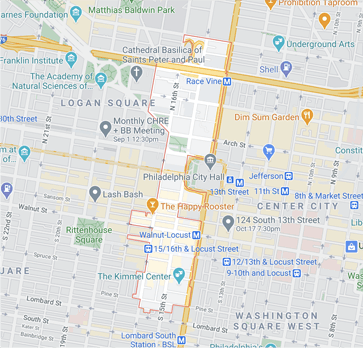
| Year | Units Listed | AVG. Listing Price | Units Sold | Avg. Sold Price | AVg Dom |
|---|---|---|---|---|---|
| 2019 | 30 | $774,293 | 28 | $669,050 | 85 |
| 2020 | 36 | $929,725 | 16 | $494,313 | 99 |

| Year | Units Listed | AVG. Listing Price | Units Sold | Avg. Sold Price | AVg Dom |
|---|---|---|---|---|---|
| 2019 | 92 | $915,968 | 93 | $673,810 | 83 |
| 2020 | 129 | $856,585 | 84 | $775,616 | 93 |
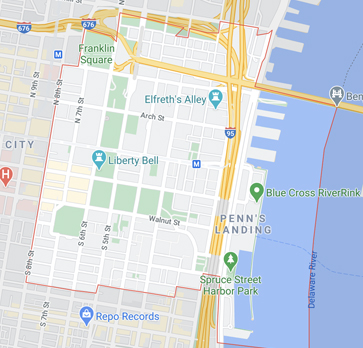
| Year | Units Listed | AVG. Listing Price | Units Sold | Avg. Sold Price | AVg Dom |
|---|---|---|---|---|---|
| 2019 | 74 | $716,654 | 62 | $649,411 | 85 |
| 2020 | 76 | $660,364 | 64 | $657,970 | 62 |
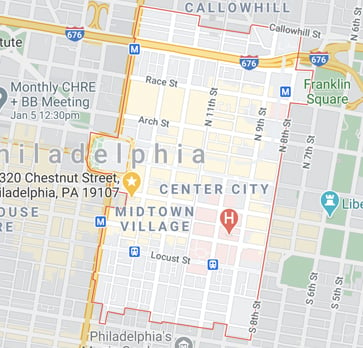
| Year | Units Listed | AVG. Listing Price | Units Sold | Avg. Sold Price | AVg Dom |
|---|---|---|---|---|---|
| 2019 | 37 | $448,513 | 36 | $395,547 | 63 |
| 2020 | 47 | $414,313 | 34 | $384,806 | 64 |
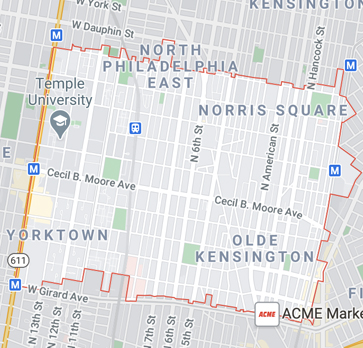
| Year | Units Listed | AVG. Listing Price | Units Sold | Avg. Sold Price | AVg Dom |
|---|---|---|---|---|---|
| 2019 | 141 | $350,544 | 72 | $386,936 | 53 |
| 2020 | 116 | $369,629 | 98 | $379,856 | 41 |
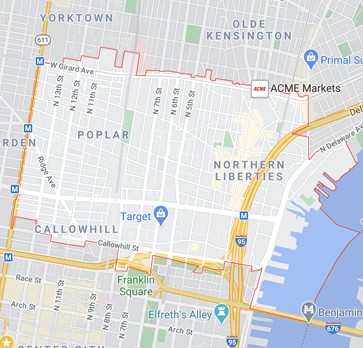
| Year | Units Listed | AVG. Listing Price | Units Sold | Avg. Sold Price | AVg Dom |
|---|---|---|---|---|---|
| 2019 | 95 | $540,652 | 34 | $529,526 | 76 |
| 2020 | 137 | $548,697 | 82 | $528,485 | 57 |
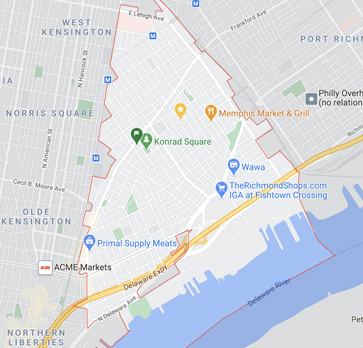
| Year | Units Listed | AVG. Listing Price | Units Sold | Avg. Sold Price | AVg Dom |
|---|---|---|---|---|---|
| 2019 | 217 | $396,253 | 202 | $365,710 | 44 |
| 2020 | 286 | $435,047 | 200 | $394,242 | 47 |
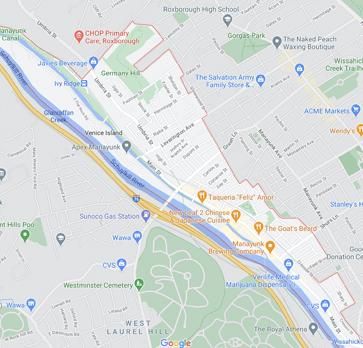
| Year | Units Listed | AVG. Listing Price | Units Sold | Avg. Sold Price | AVg Dom |
|---|---|---|---|---|---|
| 2019 | 32 | $448,584 | 38 | $406,217 | 53 |
| 2020 | 64 | $420,441 | 65 | $485,199 | 40 |
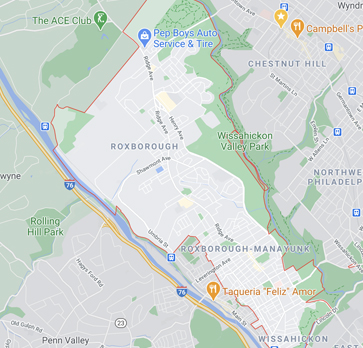
| Year | Units Listed | AVG. Listing Price | Units Sold | Avg. Sold Price | AVg Dom |
|---|---|---|---|---|---|
| 2019 | 170 | $313,132 | 157 | $284,855 | 50 |
| 2020 | 180 | $379,575 | 209 | $332,598 | 22 |
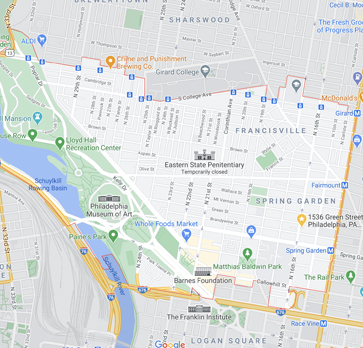
| Year | Units Listed | AVG. Listing Price | Units Sold | Avg. Sold Price | AVg Dom |
|---|---|---|---|---|---|
| 2019 | 104 | $493,840 | 113 | $411,159 | 57 |
| 2020 | 174 | $532,054 | 164 | $446,283 | 43 |
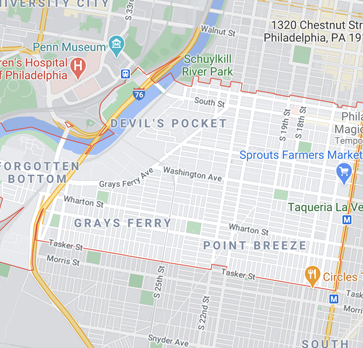
| Year | Units Listed | AVG. Listing Price | Units Sold | Avg. Sold Price | AVg Dom |
|---|---|---|---|---|---|
| 2019 | 320 | $429,811 | 221 | $405,188 | 52 |
| 2020 | 358 | $470,512 | 249 | $497,844 | 35 |
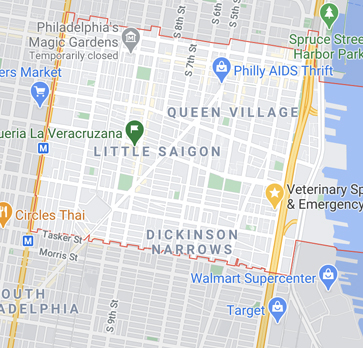
| Year | Units Listed | AVG. Listing Price | Units Sold | Avg. Sold Price | AVg Dom |
|---|---|---|---|---|---|
| 2019 | 193 | $3,445,138 | 148 | $492,198 | 63 |
| 2020 | 247 | $552,088 | 206 | $512,221 | 46 |
