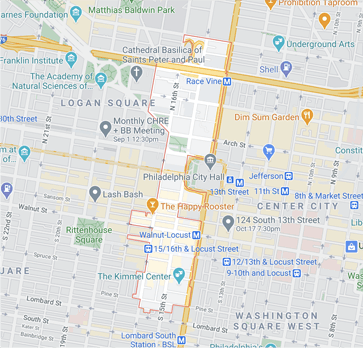
| Year | Units Listed | AVG. Listing Price | Units Sold | Avg. Sold Price | AVg Dom |
|---|---|---|---|---|---|
| 2022 | 25 | $601,104 | 15 | $569,933 | 105 |
| 2023 | 21 | $1,193,071 | 11 | $440,900 | 57 |

| Year | Units Listed | AVG. Listing Price | Units Sold | Avg. Sold Price | AVg Dom |
|---|---|---|---|---|---|
| 2022 | 102 | $1,139,265 | 63 | $705,911 | 76 |
| 2023 | 118 | $1,032,016 | 67 | $705,147 | 76 |
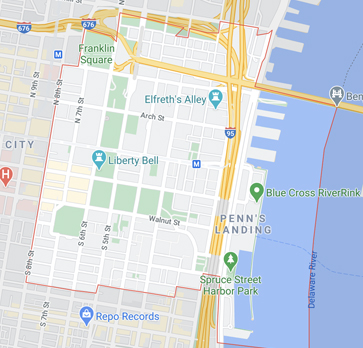
| Year | Units Listed | AVG. Listing Price | Units Sold | Avg. Sold Price | AVg Dom |
|---|---|---|---|---|---|
| 2022 | 58 | $846,726 | 47 | $656,700 | 56 |
| 2023 | 53 | $737,618 | 48 | $548,575 | 80 |
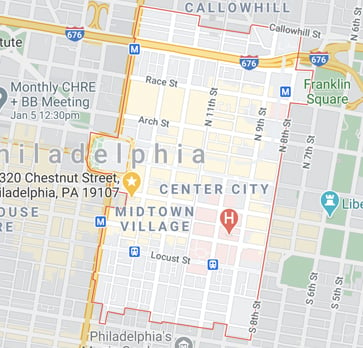
| Year | Units Listed | AVG. Listing Price | Units Sold | Avg. Sold Price | AVg Dom |
|---|---|---|---|---|---|
| 2022 | 45 | $706,411 | 21 | $573,802 | 58 |
| 2023 | 42 | $594,302 | 22 | $450,448 | 61 |
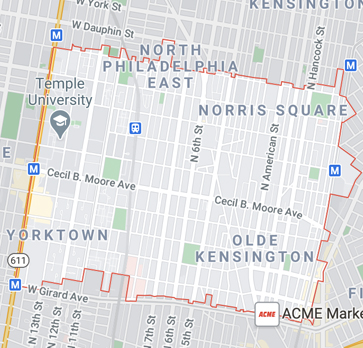
| Year | Units Listed | AVG. Listing Price | Units Sold | Avg. Sold Price | AVg Dom |
|---|---|---|---|---|---|
| 2022 | 107 | $456,308 | 45 | $424,305 | 62 |
| 2023 | 75 | $387,195 | 37 | $364,173 | 91 |
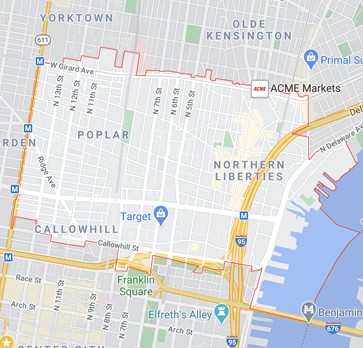
| Year | Units Listed | AVG. Listing Price | Units Sold | Avg. Sold Price | AVg Dom |
|---|---|---|---|---|---|
| 2022 | 102 | $558,503 | 50 | $554,254 | 60 |
| 2023 | 72 | $655,012 | 43 | $547,189 | 44 |
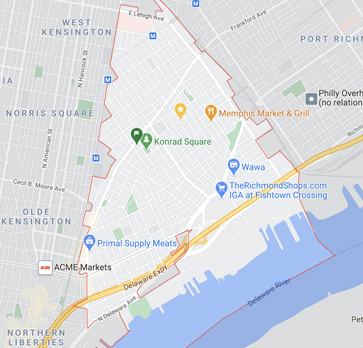
| Year | Units Listed | AVG. Listing Price | Units Sold | Avg. Sold Price | AVg Dom |
|---|---|---|---|---|---|
| 2022 | 179 | $481,074 | 137 | $508,971 | 45 |
| 2023 | 170 | $470,305 | 102 | $385,837 | 61 |
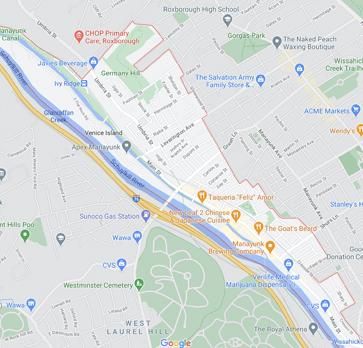
| Year | Units Listed | AVG. Listing Price | Units Sold | Avg. Sold Price | AVg Dom |
|---|---|---|---|---|---|
| 2022 | 33 | $406,981 | 27 | $339,678 | 34 |
| 2023 | 25 | $366,780 | 28 | $391,096 | 31 |
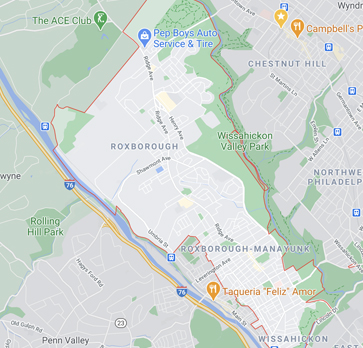
| Year | Units Listed | AVG. Listing Price | Units Sold | Avg. Sold Price | AVg Dom |
|---|---|---|---|---|---|
| 2022 | 138 | $393,504 | 122 | $345,662 | 26 |
| 2023 | 109 | $437,270 | 87 | $396,355 | 29 |
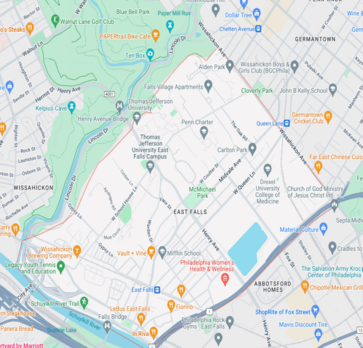
| Year | Units Listed | AVG. Listing Price | Units Sold | Avg. Sold Price | AVg Dom |
|---|---|---|---|---|---|
| 2022 | 35 | $331,100 | 26 | $358,179 | 22 |
| 2023 | 29 | $345,665 | 35 | $318,250 | 24 |
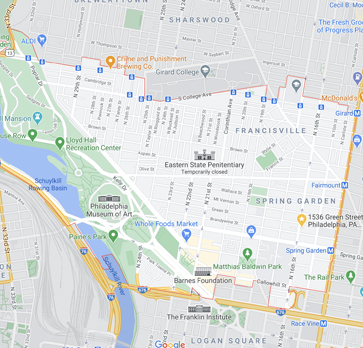
| Year | Units Listed | AVG. Listing Price | Units Sold | Avg. Sold Price | AVg Dom |
|---|---|---|---|---|---|
| 2022 | 114 | $489,263 | 89 | $446,462 | 39 |
| 2023 | 107 | $579,862 | 71 | $487,085 | 35 |
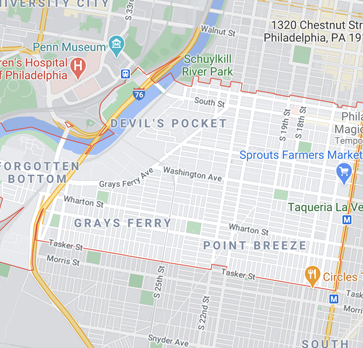
| Year | Units Listed | AVG. Listing Price | Units Sold | Avg. Sold Price | AVg Dom |
|---|---|---|---|---|---|
| 2022 | 262 | $542,732 | 123 | $470,055 | 53 |
| 2023 | 218 | $559,207 | 150 | $545,391 | 56 |
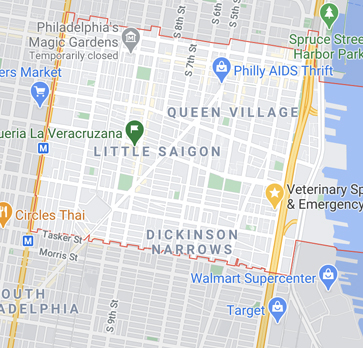
| Year | Units Listed | AVG. Listing Price | Units Sold | Avg. Sold Price | AVg Dom |
|---|---|---|---|---|---|
| 2022 | 127 | $590,106 | 118 | $548,928 | 58 |
| 2023 | 134 | $585,956 | 101 | $534,990 | 59 |
.jpg)
| Year | Units Listed | AVG. Listing Price | Units Sold | Avg. Sold Price | AVg Dom |
|---|---|---|---|---|---|
| 2022 | 122 | $282,361 | 127 | $269,868 | 37 |
| 2023 | 116 | $301,258 | 110 | $276,255 | 22 |
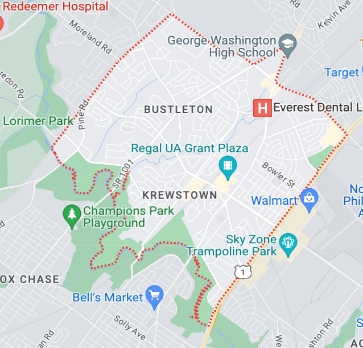
| Year | Units Listed | AVG. Listing Price | Units Sold | Avg. Sold Price | AVg Dom |
|---|---|---|---|---|---|
| 2022 | 62 | $353946 | 70 | $353,404 | 18 |
| 2023 | 71 | $416,946 | 66 | $384,089 | 26 |
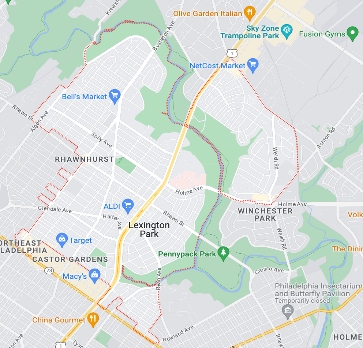
| Year | Units Listed | AVG. Listing Price | Units Sold | Avg. Sold Price | AVg Dom |
|---|---|---|---|---|---|
| 2022 | 62 | $353946 | 70 | $353,404 | 18 |
| 2023 | 73 | $323,150 | 61 | $308,423 | 26 |
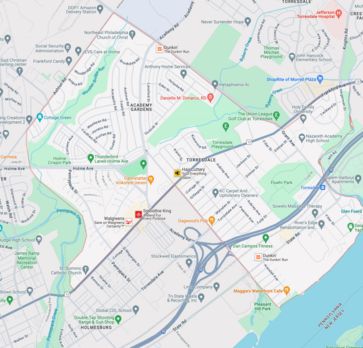
| Year | Units Listed | AVG. Listing Price | Units Sold | Avg. Sold Price | AVg Dom |
|---|---|---|---|---|---|
| 2022 | 69 | $292,409 | 80 | $285,176 | 29 |
| 2023 | 82 | $319,792 | 64 | $307,588 | 23 |
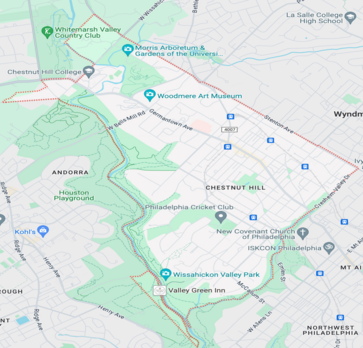
| Year | Units Listed | AVG. Listing Price | Units Sold | Avg. Sold Price | AVg Dom |
|---|---|---|---|---|---|
| 2022 | 18 | $864,988 | 20 | $977,200 | 37 |
| 2023 | 25 | $1,458,992 | 20 | $953,100 | 31 |
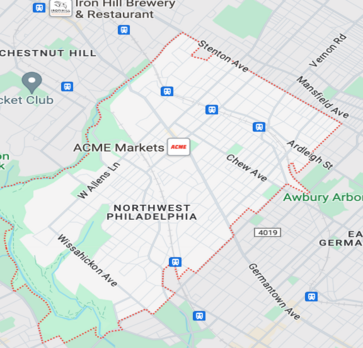
| Year | Units Listed | AVG. Listing Price | Units Sold | Avg. Sold Price | AVg Dom |
|---|---|---|---|---|---|
| 2022 | 99 | $392,115 | 84 | $422,019 | 49 |
| 2023 | 62 | $426,486 | 69 | $413,367 | 40 |
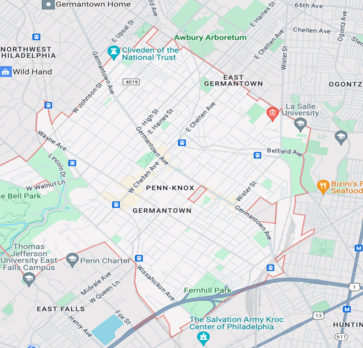
| Year | Units Listed | AVG. Listing Price | Units Sold | Avg. Sold Price | AVg Dom |
|---|---|---|---|---|---|
| 2022 | 131 | $235,380 | 63 | $197,100 | 45 |
| 2023 | 107 | $267,163 | 55 | $219,390 | 47 |
